Transforming Data Fall 2012
Thursdays
7:00pm-9:45pm
Arnhold Hall 55 W13th 306
Instructor: Zannah Marsh. zmarsh10 at gmail.com.
Course Description
We are living in the midst of a data explosion: a sudden accumulation of huge volumes of data – much of it readily accessible online – describing our everyday world from global economic fluctuations to social networking trends and traffic patterns. The evaluation of data has become a defining factor in our media world. But how does this raw data become narrative? What alchemy transforms data from information into meaning? And when data is collected and selected, what is omitted or erased? Data visualization typically is illustrative and utilitarian, but data can be artfully unraveled and re-expressed to tell stories and convey powerful sentiments. This course examines information design strategies and the visual language of the infographic as a starting point in creating our own data-based works. Students experiment with approaches to data that are playful, reverent, poetic, beautiful, subversive, and ultimately narrative. The class considers works by Fernanda Viegas and Martin Wattenberg, Christian Nold, Nicolas Felton, Mark Napier, Hasan Elahi, and Chris Jordan. Assigned texts will include writings by media theorists, information designers, scientists, and artists such as Colin Ware, Lev Manovich, Edward Tufte, and Sol LeWitt. Students will be introduced to very basic programming skills in the open source language Processing, and we experiment with the range of online tools for creating visualizations such as the IBM’s Many Eyes project, Daytum, and Infogram. By the end of the semester, will working with data sets to generate dynamic representations, screen-based artworks, and digital prints.
Grading Breakdown
Class participation 20%
Homework: 30%
Midterm project: 20%
Final project: 30%
Course Goals
- learn basic strategies and forms for displaying visual information, and evaluating merits of these strategies and forms
- become a critical consumer of information graphics
- learn basic programming skills, using Processing
- use Processing, analog techniques, web visualization tools, and/or image processing software to make your own visualizations
- explore creative possibilities for data visualization
Time Commitment:
In addition to class time, expect to spend 2-4 hours in between each class on readings and assignments.
Textbooks and Readings
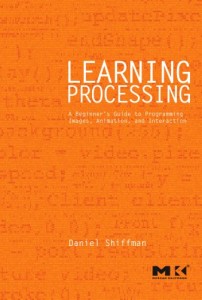
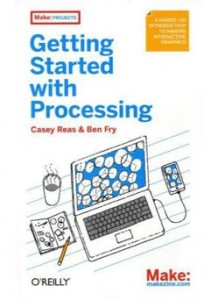
Most readings will be handouts or .pdf files emailed to you. For Processing textbooks, there are two books I recommend (click on images to link to Amazon for purchase):
Attendance, Lateness, Attention, and Social Media Policy
Attendance to every class is required. If you have more than 2 absences, you will FAIL the class. Repeated lateness will accumulate into an absence. Late assignments will not be accepted. Please don’t text, chat, tweet, use facebook or email during class time. Do this during the breaks. Phones off and in bags. Please pay attention while your classmates are presenting their work; learning to listen carefully and talk intelligently about other people’s work will make YOUR work better.


