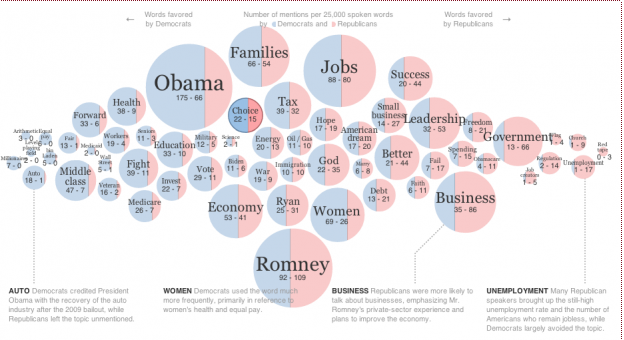
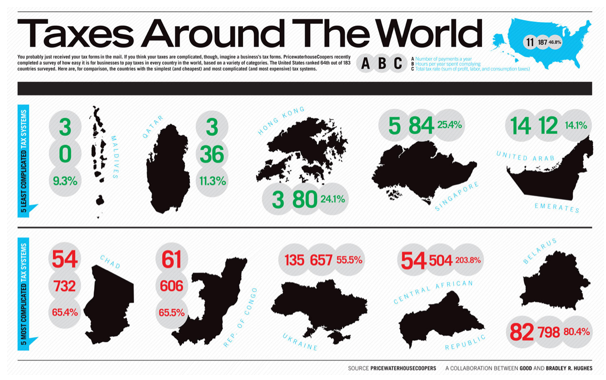
Cool Text Visualizations and Reminder….


Text Visualization by Stefanie Posavec Hi Res images

Choose Your Own Adventure Visualization

Album Visualization: Illinois/Sufijan Stevens by Jax De Leon

(ALSO)

REMINDER…
End of semester course evaluations~
You can access their course-rating surveys in three ways: through a link in the email you receive, by clicking on a link you see when they log into Blackboard, and through a mobile app for Apple and Android smartphones. Complete your course evaluations before December 19th.

Thanks!
Zannah

Your thoughts and comments on the Brooklyn Historical Society field trip

map

Before our next class meeting, take some time to look at the data sets provided (via my email to you) and think about your experience with the materials on-site. What was most interesting or striking to you about the materials? What would kind of questions or connections came to mind as you looked at specific materials? What questions came to mind when you considered the collection as a whole? Of the sets data we’ve been provided, what parameters or combination of parameters (dates, call numbers, titles/descriptions, subjects, locations, names, tags, etc) are most interesting, and what formats might be best to visualize them?

Comment on this post with your thoughts! (I will be approving the comments as they come in, so if yours doesn’t show up immediately it just means it’s been held for approval.)

Adam’s Presentation Links on Visualizing Social Networks

Presentation
New York Times R&D – Project Cascade: http://nytlabs.com/projects/cascade.html
Project Cascade Video (Silent): http://www.youtube.com/watch?v=OPr3x9CRDDw
Bonus: TEDxVancouver – Jer Thorp (New York Times R&D) – The Weight of Data: http://www.youtube.com/watch?v=-q6aA5qdCzU
My Linked InMap: see attached
Bonus: DJ Patil explaining LinkedIn social graph visualizations - http://www.youtube.com/watch?v=se2u5RyGaNE
Facebook Engineering Intern Paul Butler – Visualizing Friendships – https://www.facebook.com/note.php?note_id=469716398919
Facebook Engineer Jack Lindamood: https://www.facebook.com/jack?ref=blog
Facebook Visualization – Project Palantir (Facebook Hackathon): http://www.youtube.com/watch?v=wTQf8MqEfg0
Non-releated Bonus

Bonus: Fernanda Viégas & Martin Wattenberg, IBM Visual Communication Lab - Democratizing Visualization- PARC Forum http://www.youtube.com/watch?v=E2BoolESJf4
Bonus: Palantir (not related to the Facebook project above) CEO Dr. Alex Karp on Charlie Rose (on the power of data in global politics) –  http://www.palantir.com/what-we-do/

Searches, Maps, etc.

Analyzing Google Searches to Predict Voting Behavior

Finding data:
USGS
NYC Open Data
Data.gov

Geo-Mapping projects:

Stamen Design: Energy Efficiency in the San Gabriel Valley
Is “efficiency” negative or positive? What’s the community vs. individual resident impact? Note grid density encoding.

State of the Polar Bear
Data density, multiple forms, compare across small multiples. “Drilling down.” Interface cues, multiple access points for the same data. Audience?

Personal Mapping Projects
Everywhere I’ve been
and
Altas of the Habitual

More GPS visualizations
Infrastructure/supply chain visualizations from PBS
Welcome to the Anthropcene
3D visualization movie with graph overlay and voice over.

+++++++++++++++++++

Reverse Sonification:
Microsonic Landscapes

Misc Network/Relationship Map-Art Project:
Mark Lombardi Scandal Maps
Mark Lombardi Article

Some SVG files (Brooklyn, NYC, USA) should you need them…

Brooklyn Historical Society’s Collection of Maps (sent via email)
Visualizing a “collection.” User goals: directed search vs. serendipitous interaction.
NYPL’s “Explore” functionality

Class 5: Code, Lecture Notes, plus Homework.

Code examples here.

Lecture Slides here.

Homework:

1) Data collection for midterm. Continue to gather your data! Add a category or a new method of collection.  A new way of collection you want to try? Now that you’ve been collecting for a week, is there another category of data you’d like to add?

2) Processing. Look at the three example sketches for this week, read through the comments and code until you have a good understanding of how it works.Email me if you have any questions. Then create the following two sketches:
a) See if you can modify myAgesArray.pde to include the names of your classmates below  the circle representing their ages. Make a string array and use the text() function in the loop to print the names.
b) Extend the functionality of the above program to load an external text file with your classmate’s names. You’ll have to create the text file, add it to the sketch, and use loadStrings( ) to get it into an array.

Reading on Arrays, if needed: Ch. 10 in Getting Started With Processing (pp141-150); Ch. 9 in Learning Processing (pp141-162)